Remote monitoring platform
One Board
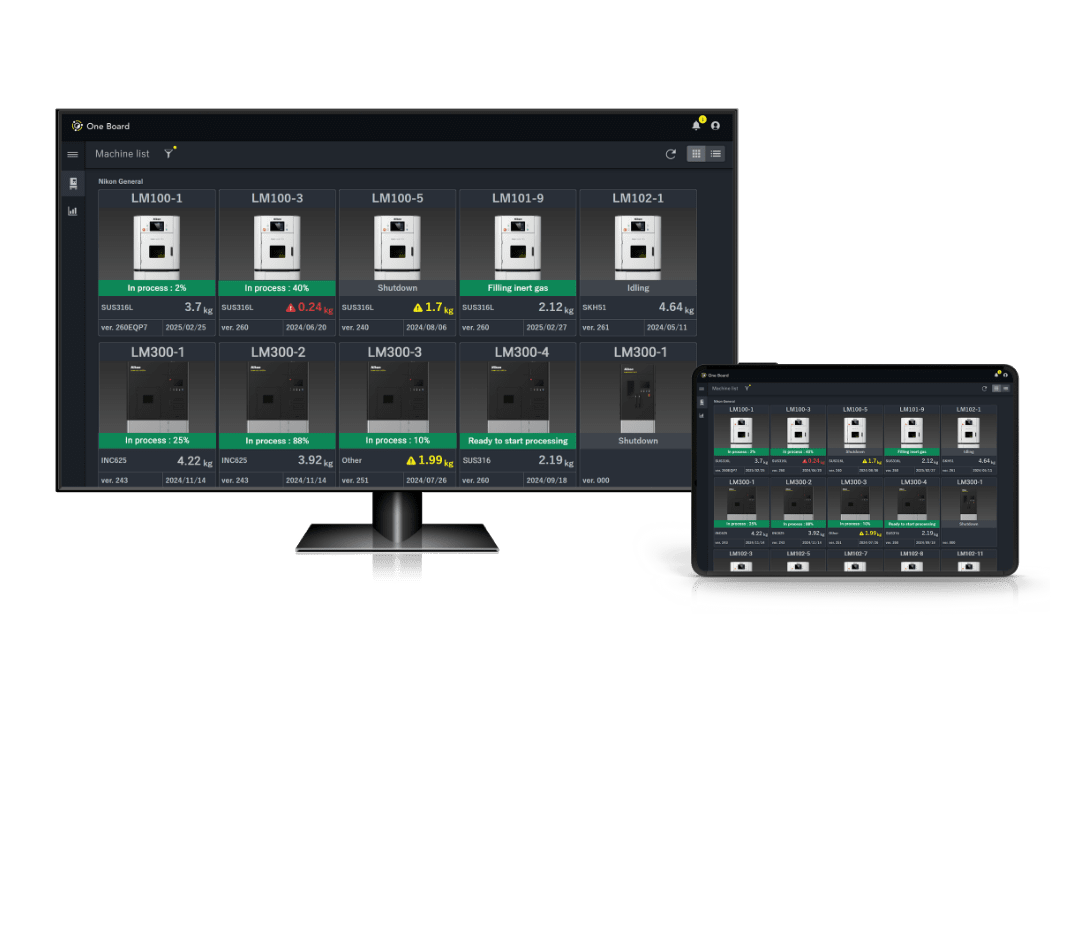
This is a cloud platform that remotely monitors the status of devices and contributes to their stable operation, improves work efficiency via e-mail notifications and is mobile device compatible.
One Board
This is a cloud platform that remotely monitors the status of devices and contributes to their stable operation, improves work efficiency via e-mail notifications and is mobile device compatible.
6 reasons to introduce One Board
You can easily check the status of a device from any location.

You can check the status of a metal 3D printer, which has a long processing time, in real time, making new ways of working possible, such as arriving on-site when processing ends.
Downtime can be reduced.

Even if the device stops due to an error, you can quickly identify the error via an e-mail notification. This enables a reduction in the time the device is stopped.
You can see the device operating rate at a glance.

You can check the operating and processing rates of the device by just clicking a button. This is a convenient function that can be used to report to the person in charge and catch up on the current situation, thus improving operating rates.
Immediate response to problems

Sharing the status of a device with Nikon's customer support enables early resolution of problems.
Mobile device compatible!

You can also use One Board on mobile devices such as smartphones and tablets, in addition to PCs.
One Board is free of charge!

Because you can start using One Board free of charge, you can start using is straight away.
* Some functions are restricted in the free plan.
Problems that can be solved
Introduction of functions
For the functions of the One Board remote monitoring platform, refer to the following.